Devpost
Participate in our public hackathons
Devpost for Teams
Access your company's private hackathons
Grow your developer ecosystem and promote your platform
Drive innovation, collaboration, and retention within your organization
By use case
Blog
Insights into hackathon planning and participation
Customer stories
Inspiration from peers and other industry leaders
Planning guides
Best practices for planning online and in-person hackathons
Webinars & events
Upcoming events and on-demand recordings
Help desk
Common questions and support documentation
Layanan analisis hotel dengan mudah bagi turis. Informasi didapatkan melalui dataset Traveloka.
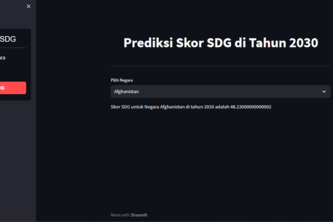
Transparasi Data Menuju Indonesia Sejahtera
This app helps user visualize and view data related to the SDG scores of countries around the globe.
A very simple app that displays the temperature, dewpoint, and apparent temperature forecast in Jabodetabek with line charts using data from the open-source weather forecast API called open-meteo.
In this Streamlit App we did data analytics on the sustainable development goals score of countries on earth
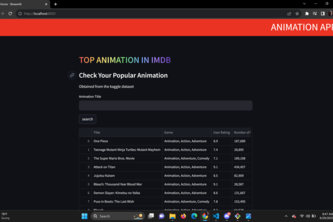
Aplikasi ini berfungsi untuk melihat data-data animasi, filter untuk mencari animasi, dan rating dari animasi tersebut
Melihat 10 game terbaik dan distribusinya dalam platform yang dipakai.
Stunting Data Visualization Website using Streamlit. Submitted for Sickathon competition, infographic website about stunting and data visualization.
1 – 8 of 8